Ocean data visualization
People involved: Toshit Jain, Varun Singh, Vijay Kumar Boda and Upkar SinghOceanography refers to the study of the physical, biological, and chemical features and characteristics of the ocean. A comprehensive study of the oceans of the earth has implications for scientific understanding, environmental management, and societal well-being. It is crucial for predicting extreme weather phenomena like hurricanes and tsunamis, enhancing our understanding of large-scale planetary processes such as global warming, and ensuring the sustainable management and preservation of ocean resources and marine ecosystems. With the advancements in collection and generation of ocean data, there is a demand for scalable tools that support effective and interactive visualization of ocean data. Data in oceanography typically consists of multivariate 3D spatiotemporal fields. The fields are generated using simulations or available from satellite imagery, buoy sensors, or in-situ physical observations. Thanks to the explosion in the capability of modern computers and imaging technology, the size of ocean datasets is becoming larger and larger. As a result, visualizing these datasets at interactive speeds is a challenging problem. Further, the datasets are seldom stored locally. The storage on remote servers results in an additional time cost that is dependent on the bandwidth. The dynamic nature of the multiple scalar and vector fields representing physical quantities pose further challenges to the development of efficient visualization methods.
pyParaOcean: a 3D, scalable and interactive tool for visualization of ocean data
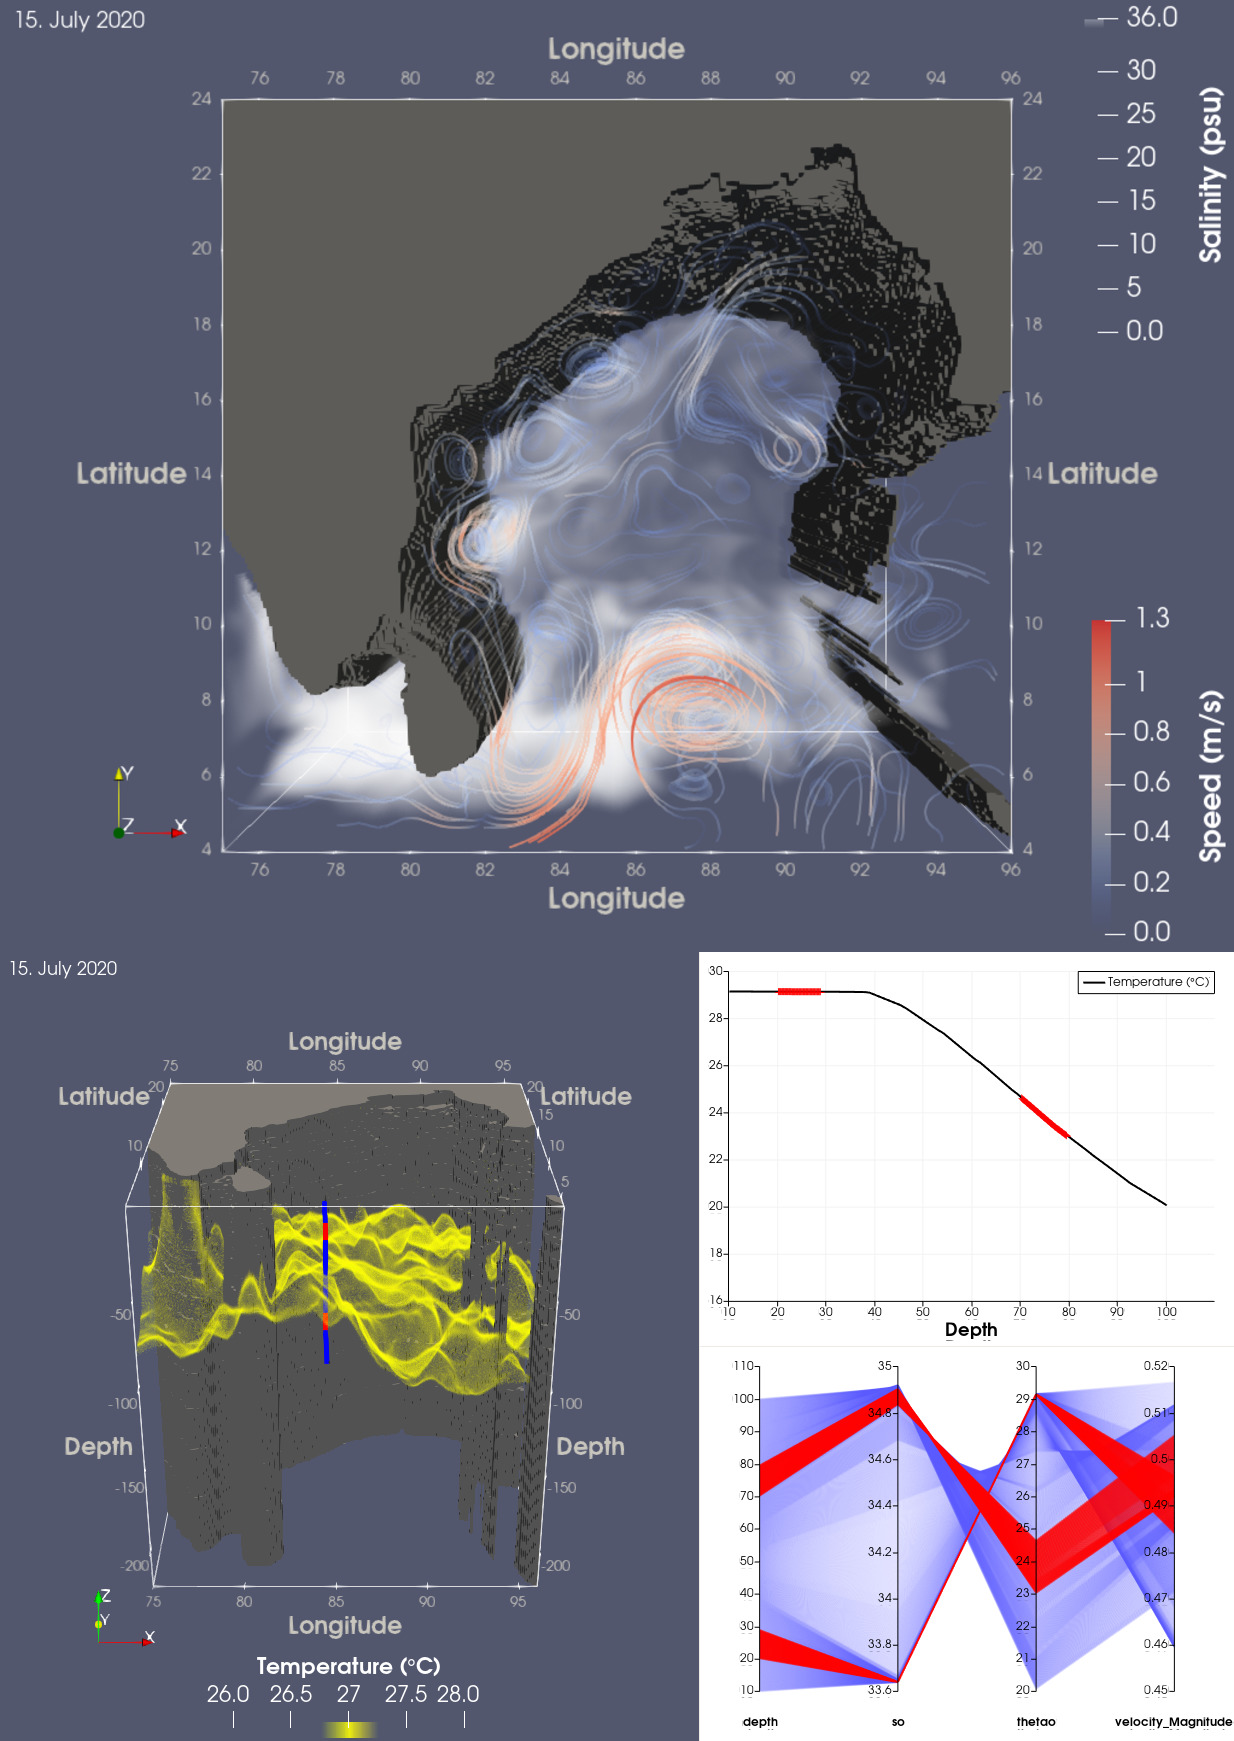
pyParaOcean is a system for interactive exploration and visual analysis of ocean data. The system leverages the functionalities of ParaView to enable scalable visualizations of data available from high resolution ocean models while supporting a multitude of tasks and functionalities that are specialized for oceanography. These functionalities include, but are not limited to, streamline and pathline visualizations with different seeding strategies, surface front tracking, eddy visualization, depth profile visualizations with a parallel coordinates plot and Cinema Science database generator for a quick overview of data.Front-based and Skeleton-based Salinity Tracking
Front-based sanilty tracking extracts front-based features from high salinity water and then tracks them over time to generate the track graph. The geometry of the high salinity water is used to extract said features and the track graph represents all the paths taken by high salinity water over time. We extract selective tracks from the track graph for further analysis. This method is provided as a filter in pyParaOcean. Skeleton-based sanilty tracking extracts topological skeletons from high salinity water and then tracks them over time to genrate tracks. This method uses the topology of high salinity water and produces similar results to that obtained using the front-based method.Advection-based Salinity Tracking
Advection-based sanilty tracking extracts features called advection-fronts from high salinity water and then tracks them over time to generate the track graph. Salinity movement due to ocean advection is used for extracting these feaures, which are loactions in 3D space with very high advection. The track graph represents all the paths taken by high salinity water over time and we can extract selective tracks from the track graph for further analysis. The advection tracks obtained in Bay of Bengal indicate that the movement of high salinity water during the summer months is primarily due to advection.
Visualization of the flow using streamlines with uniform seeding and the ≥ 35 psu salinity isovolume to visualize the mixing of salt into the Bay of Bengal. The depression of the 27°C isotherm (yellow) by the anticylonic eddy in the Bay of Bengal.
Publications
- Toshit Jain, Varun Singh, Vijay Kumar Boda, Upkar Singh, Ingrid Hotz, P. N. Vinayachandran, and Vijay Natarajan.
pyParaOcean: A System for Visual Analysis of Ocean Data - Upkar Singh, P. N. Vinayachandran, and Vijay Natarajan.
Advection-Based Tracking and Analysis of Salinity Movement in the Indian Ocean - Upkar Singh, T.M. Dhipu, P. N. Vinayachandran and Vijay Natarajan.
Front and Skeleton Features Based Methods for Tracking Salinity Propagation in the Ocean