pyParaOcean: A System for Visual Analysis of Ocean Data
Toshit Jain, Varun Singh, Vijay Kumar Boda, Upkar Singh, Ingrid Hotz, P. N. Vinayachandran, and Vijay Natarajan.EnvirVis 2023: Proc. Workshop on Visualization in Environmental Sciences, 2023, 1-8.
Abstract
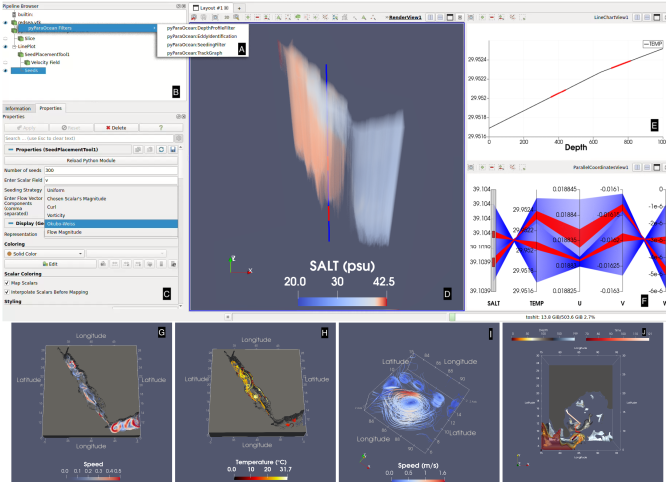
Visual analysis is well adopted within the field of oceanography for the analysis of model simulations, detection of different phenomena and events, and tracking of dynamic processes. With increasing data sizes and the availability of multivariate dynamic data, there is a growing need for scalable and extensible tools for visualization and interactive exploration. We describe pyParaOcean, a visualization system that supports several tasks routinely used in the visual analysis of ocean data. The system is available as a plugin to Paraview and is hence able to leverage its distributed computing capabilities and its rich set of generic analysis and visualization functionalities. pyParaOcean provides modules to support different visual analysis tasks specific to ocean data, such as eddy identification and salinity movement tracking. These modules are available as Paraview filters and this seamless integration results in a system that is easy to install and use. A case study on the Bay of Bengal illustrates the utility of the system for the study of ocean phenomena and processes.[PDF]