pyParaOcean - A scalable and interactive 3D ocean data visualization tool.
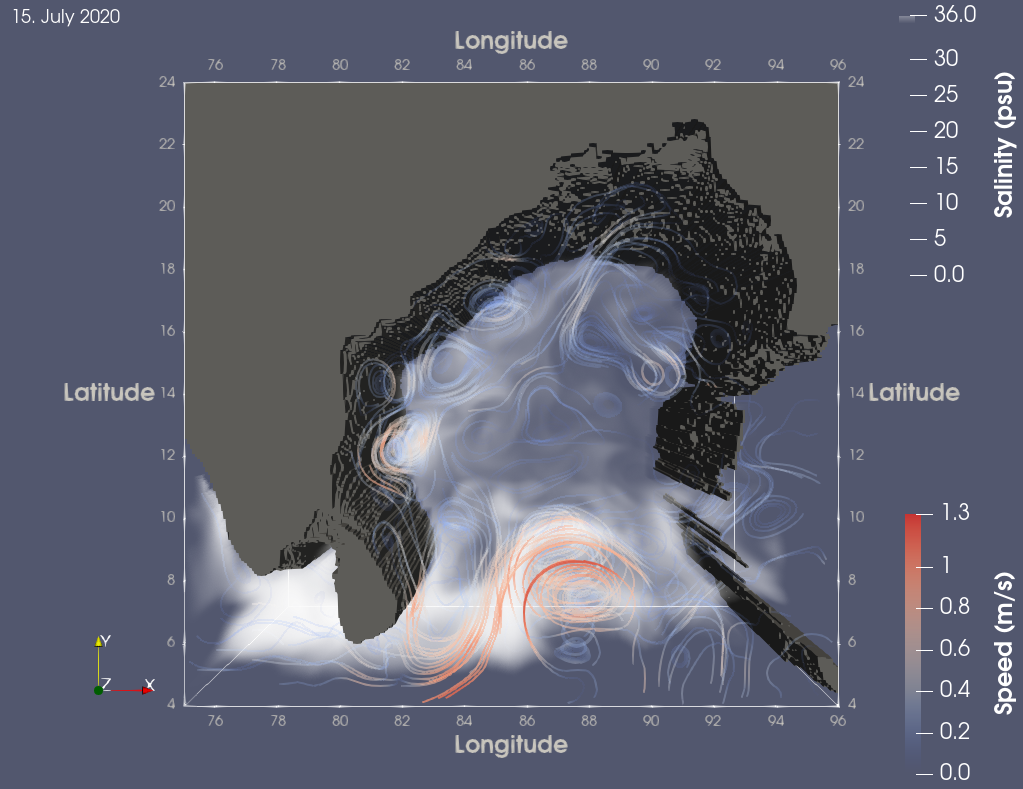
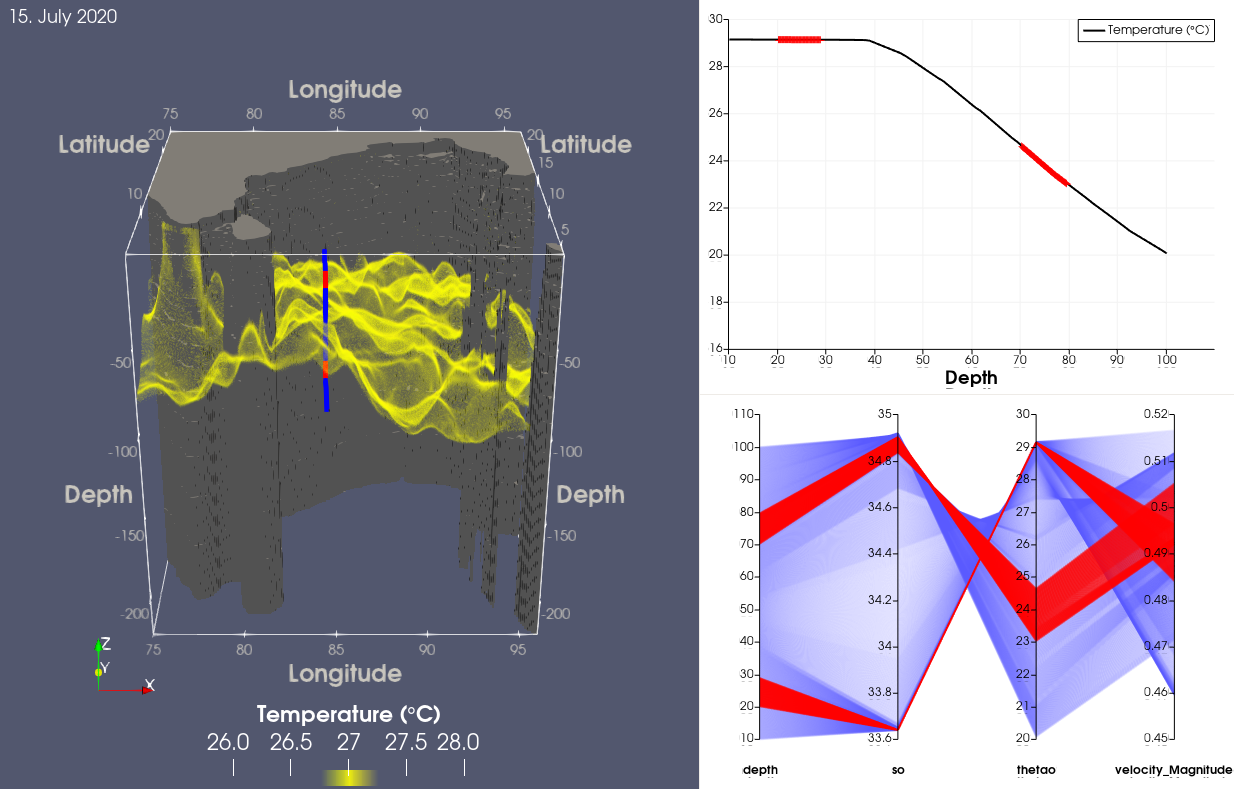
Understanding ocean data is paramount to predicting extreme weather events such as hurricanes and tsunamis, better understanding of planetary scale processes like global warming, and sustainably managing and preserving ocean resources and its marine life. Visualizing ocean data is challenging due to the presence of multiple fields and parameters that change with time. pyParaOcean is a system for interactive exploration and visual analysis of ocean data. The system leverages the functionalities of ParaView to enable scalable visualizations of data available from high resolution ocean models while supporting a multitude of tasks and functionalities that are specialized for oceanography. These functionalities include, but are not limited to, streamline and pathline visualizations with different seeding strategies, surface front tracking, eddy visualization, depth profile visualizations with a parallel coordinates plot and Cinema Science database generator for a quick overview of data.
Source code and instructions on github here.
References
- Toshit Jain, Varun Singh, Vijay Kumar Boda, Upkar Singh, Ingrid Hotz, P. N. Vinayachandran, and Vijay Natarajan.
pyParaOcean: A System for Visual Analysis of Ocean Data
EnvirVis 2023: Proc. Workshop on Visualization in Environmental Sciences, 2023, 1-8.