Continuous Scatterplot and Image Moments for Time-Varying Bivariate Field Analysis of Electronic Structure Evolution
Mohit Sharma, Talha Bin Masood, Nanna Holmgaard List, Ingrid Hotz and Vijay Natarajan.IEEE Transactions on Visualization and Computer Graphics, 31(10), 2025, 7229-7242.
Abstract
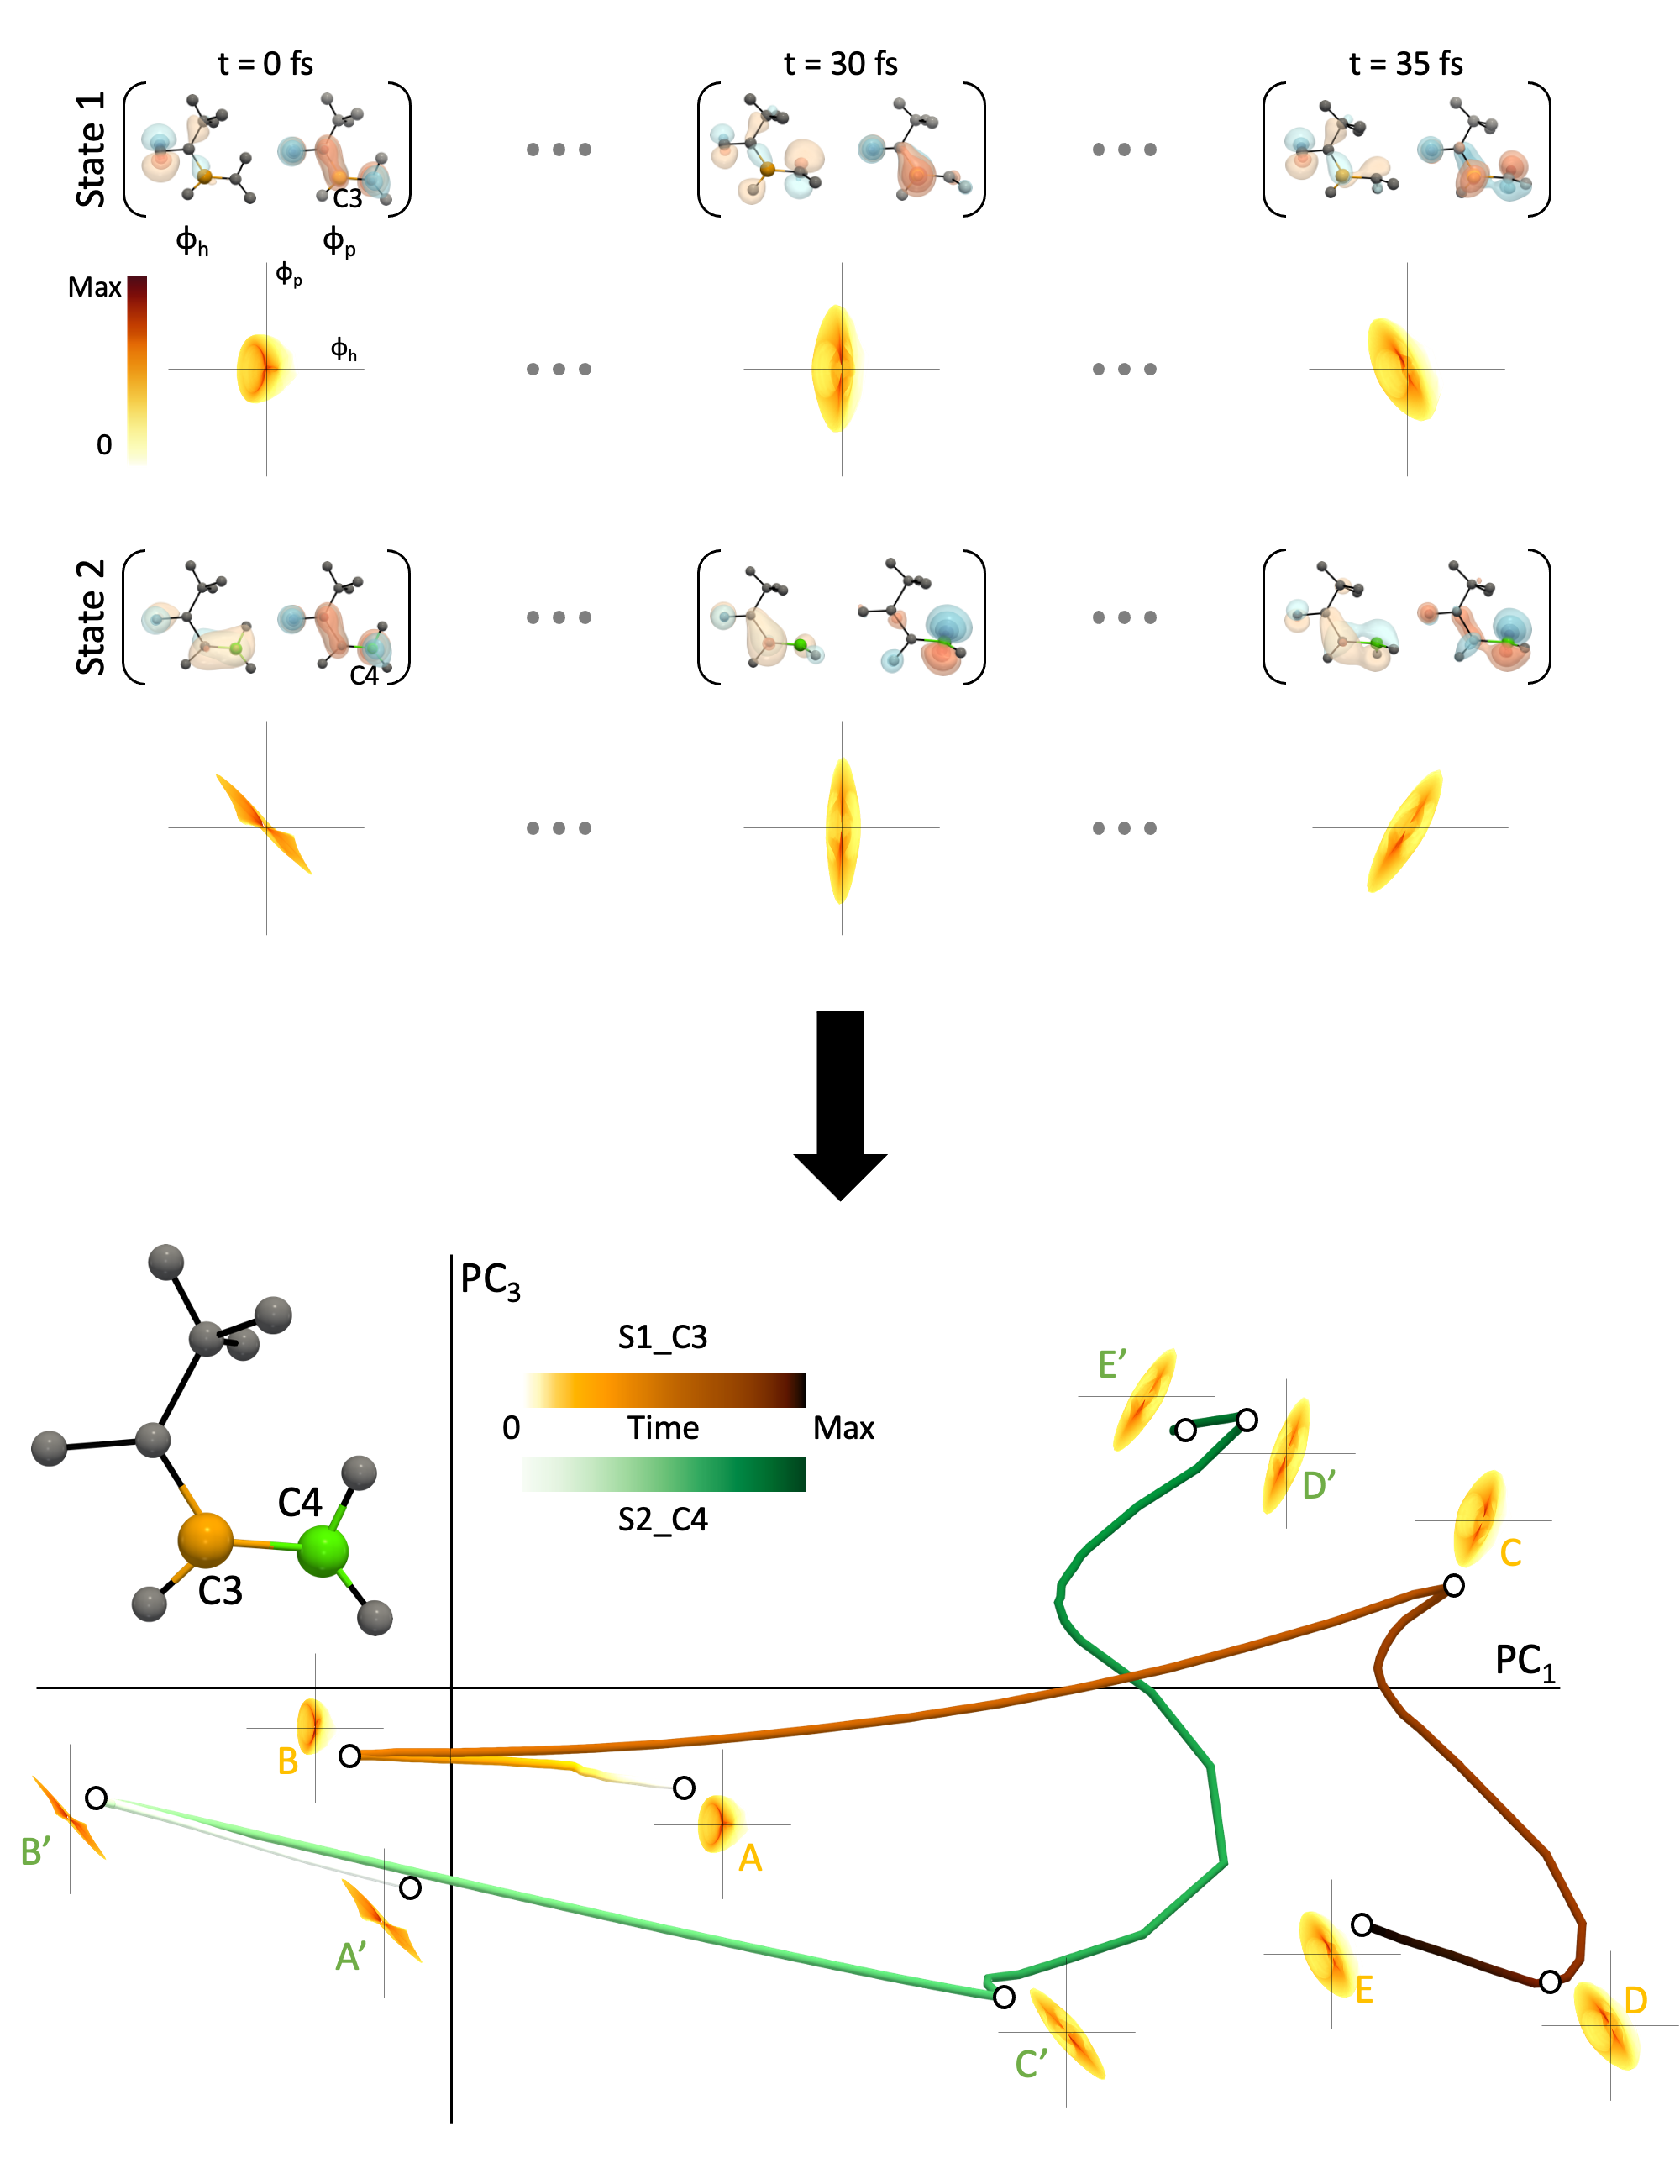
Photoinduced electronic transitions are complex quantum-mechanical processes where electrons move between energy levels due to the absorption of light. This induces dynamics i.e., coupled changes in the electronic structure and nuclear geometry, that drive physical and chemical processes of importance in diverse fields ranging from photobiology and materials design to medicine. The evolving electronic structure can be characterized by two electron density fields: hole and particle natural transition orbitals (NTOs). A study of the two density fields helps understand the movement of electronic charge from one part of the molecule to another, specifically the donor and acceptor regions. Previous works in this area rely on side-by-side visual comparisons of isosurfaces, statistical approaches, or visual analysis of bivariate fields restricted to limited time instances. We propose a new method to analyze time-varying bivariate fields with a large number of instances, as pertinent to understand electronic structure changes during light-induced dynamics. Since the NTO fields depend on the nuclear geometry, the nuclear motion leads to a large number of bivariate field instances. Structures like tracking graphs have been used to analyze time-varying univariate fields. This paper presents a structured and practical approach to feature-directed visual exploration of time-varying bivariate fields using continuous scatterplots (CSPs) and image moment-based descriptors, tailored for studying the evolving electronic structure following photoexcitation. The CSP of the bivariate field at every time step is represented using an image moment vector of length 4. The collection of all image moment vector descriptors is considered as a point cloud in ℜ4 and visualized using principal component analysis. Choosing an appropriate pair of principal components results in a representation of the point cloud as a curve on the plane. This representation supports tasks such as identifying interesting time steps, identifying patterns within the bivariate field, and tracking their evolution over time. We present two case studies on excited-state dynamics in molecular systems that demonstrate how the time-varying bivariate field analysis helps provide application-specific insights.[PDF]
Supplementary Material:
- Supplementary material for "Continuous Scatterplot and Image Moments for Time-Varying Bivariate Field Analysis of Electronic Structure Evolution" (Download)