Extremum Graph Layout and Visualization
Nandini GourAbstract
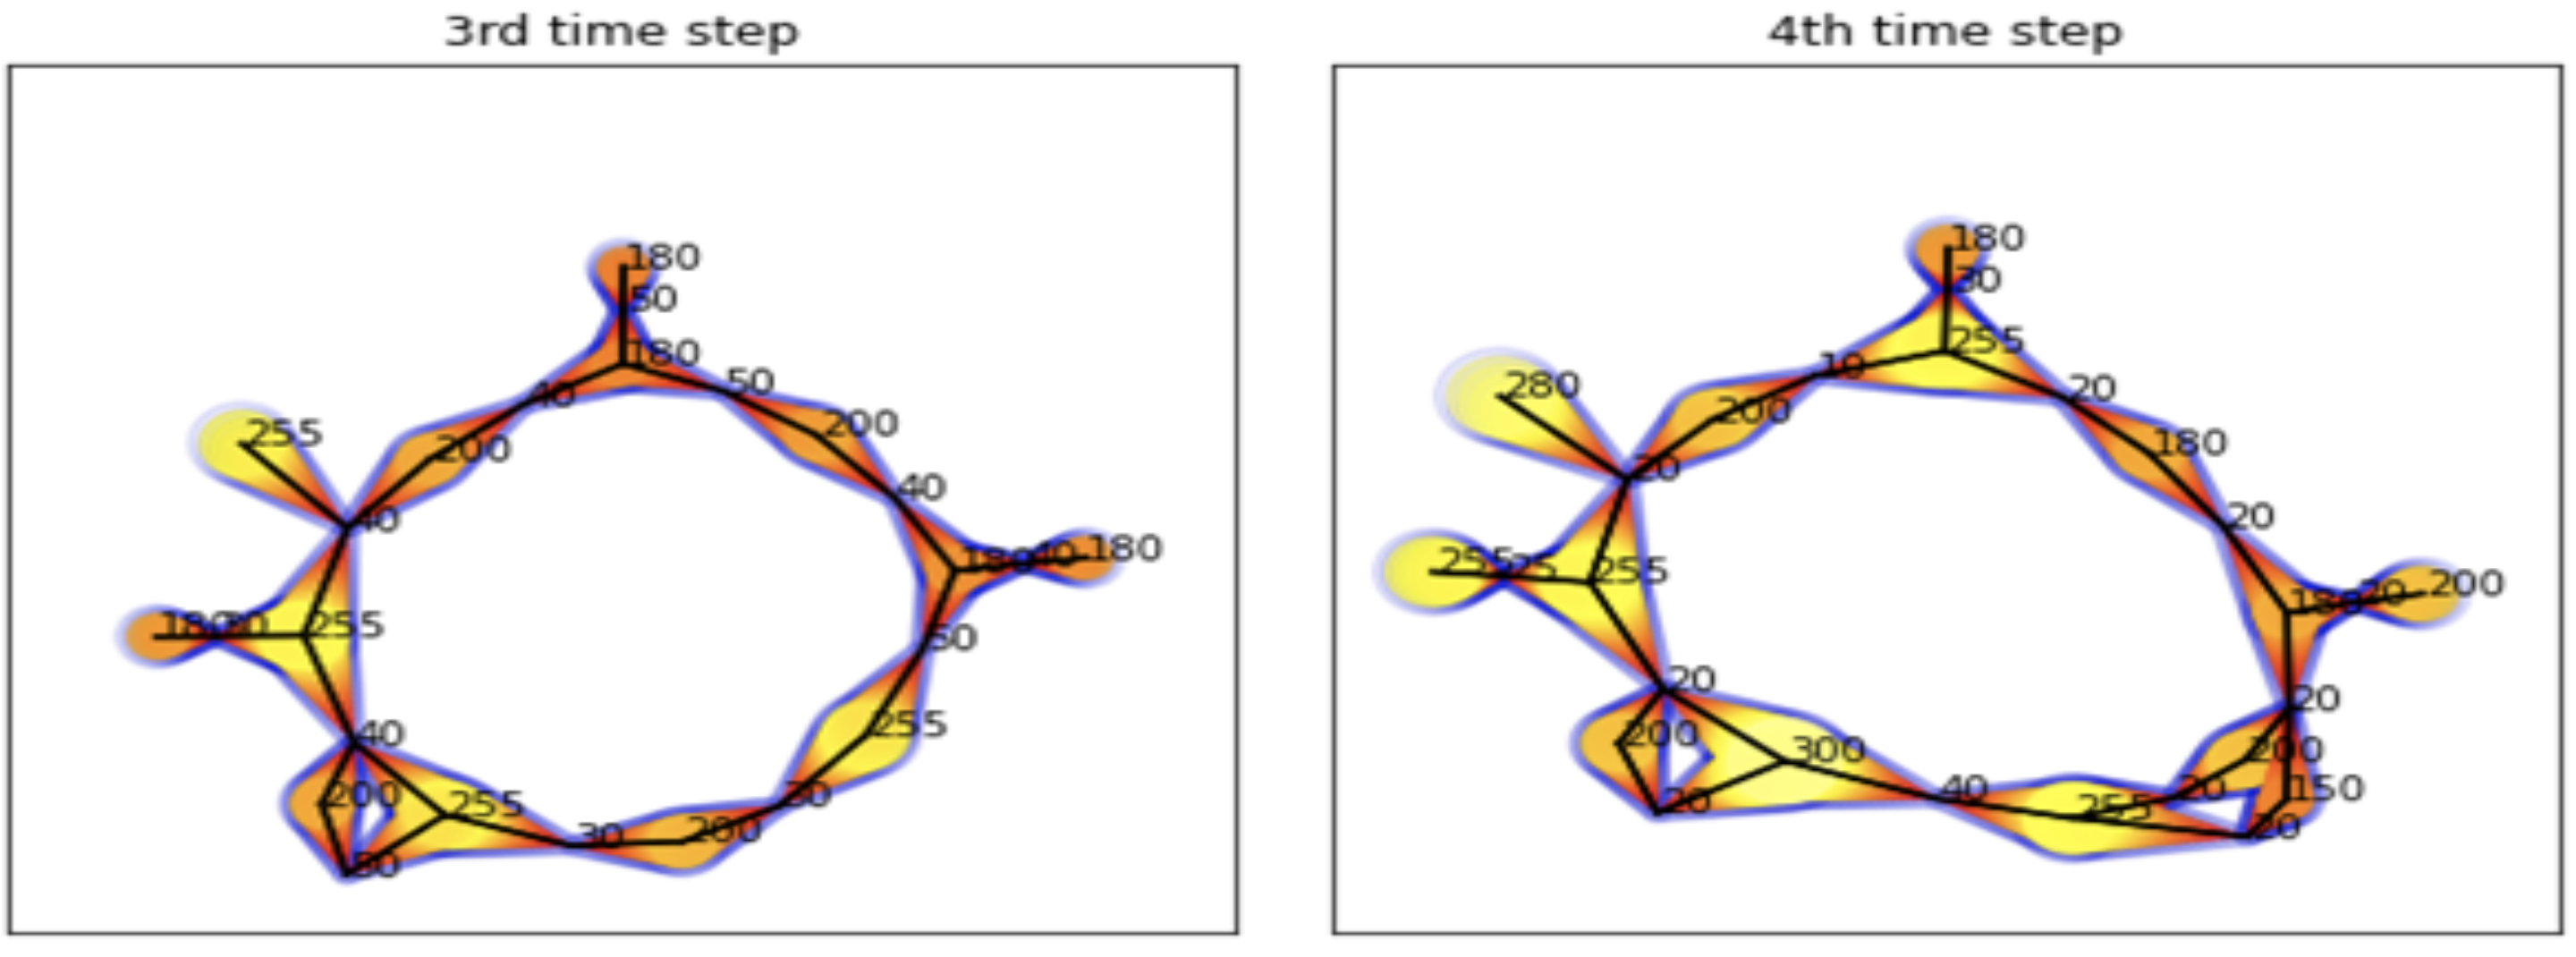
There are many tools in the field of topological analysis which provide better and more robust data analysis. They are used for many tasks such as feature extraction, comparison of datasets, etc. An extremum graph is also one of the tools used for topological analysis. Extremum graph allows us to analyze the high dimensional scalar fields while preserving the local geometric structure. The topology of scalar fields provides many essential properties, such as the number of connected components of an iso-surface or their critical points. So here, we use topological spines to visualize the extremum graph and the time-varying extremum graph. The topological spines are also used for topological analysis. It is a visual representation that preserves the topology and locality of the extrema and hierarchy of contours.[PDF]