Exploring and analyzing high dimensional data using the Extremum Graph
Meenaly YadavAbstract
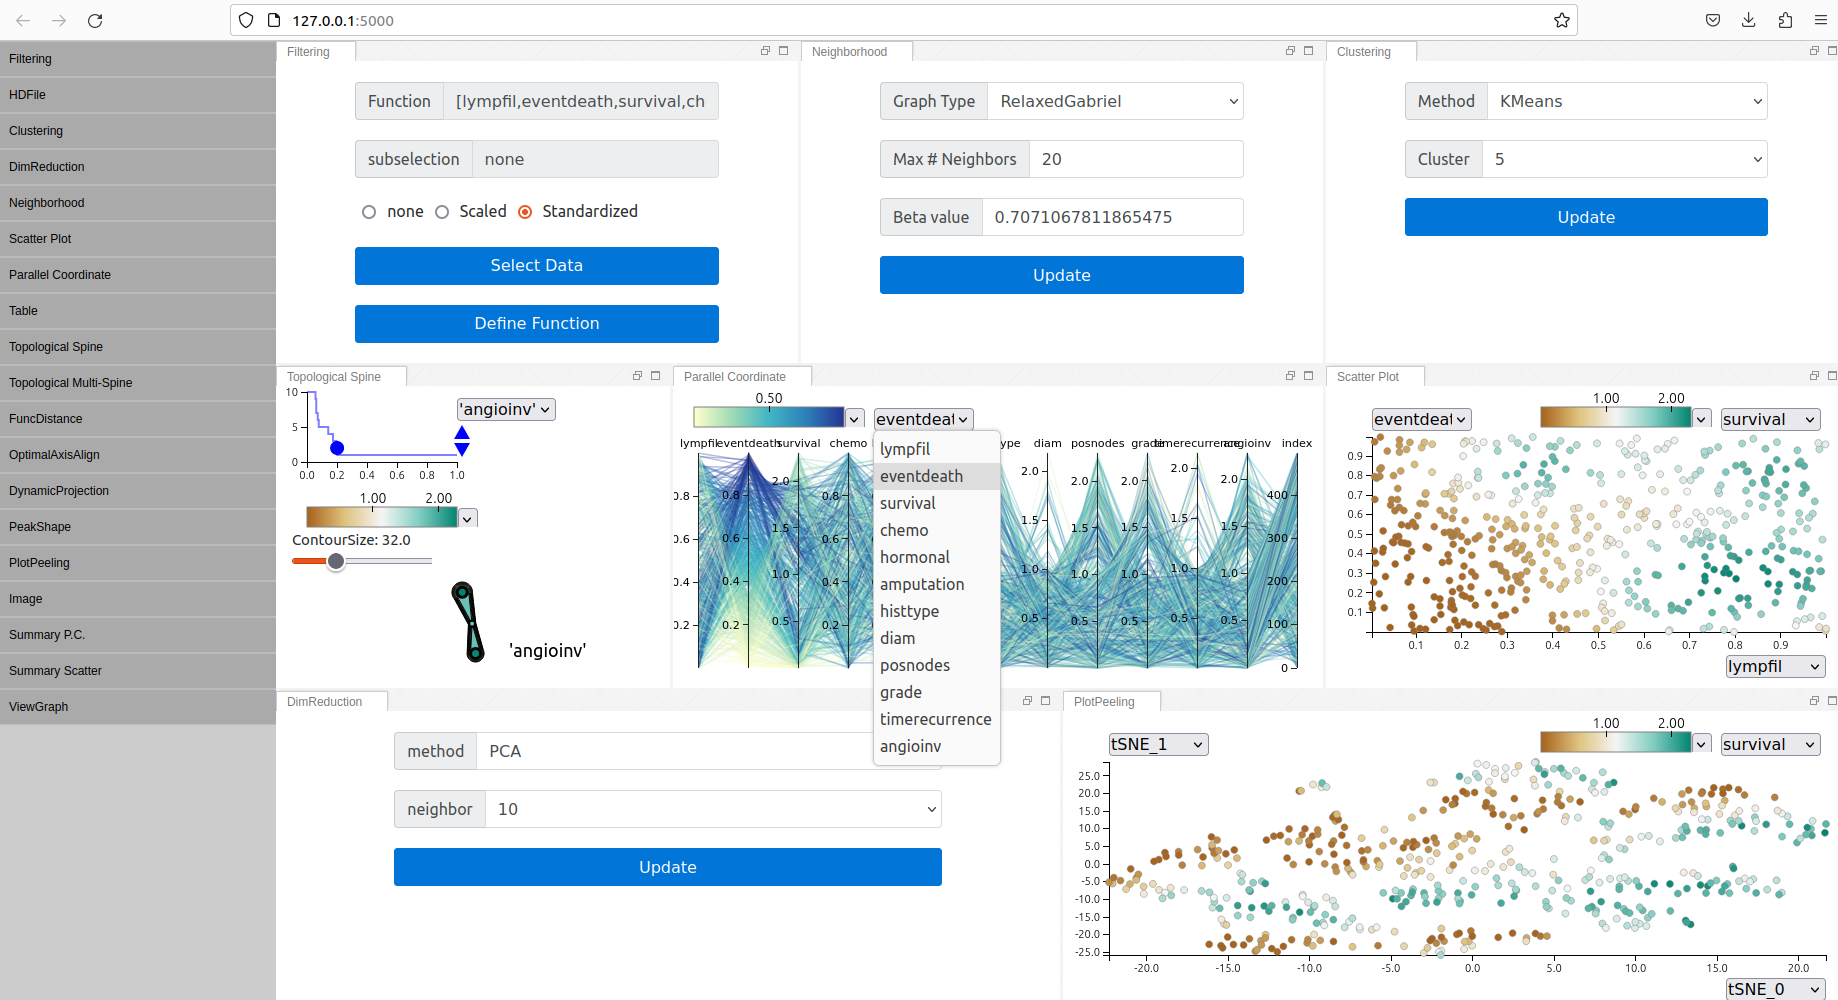
The challenges faced in visualization using machine learning techniques are - the utilization of the black box models in interpreting the model behaviors and the growth in computing produced millions of datasets that needed techniques to handle it. In this, we used the scalable solution to explore and analyze the high - dimensional functions encountered in scientific data analysis. We tried the interactive exploration of the topological and geometric aspects of the high-dimensional data by combining the neighborhood graph construction, corresponding topology computation, and data aggregation. We used the NDDAV – N-Dimensional data analysis and visualization. It is an interactive tool combination of dimension reduction, clustering, neighborhood graphs, and topological analysis. The extremum graphs become important in topology, as they allow for the dimensionality reduction and exploratory analysis of high dimensional scalar fields while preserving the geometric structure. Mostly the extrema are the exciting features of scalar fields, making the extremum graphs an appealing choice for high-dimensional analysis. We provided two use cases from computation biology and high energy physics to show how this setup have produced the findings similar to the other method in both the fields.[PDF]