Weather and Climate Data Visualization
People involved: Karran Pandey and Akash Anil ValsangkarThe volume of high resolution climate data generated by both global models and remote sensors continues to grow at a rapid pace. Modern climate scientists require advanced tools to interactively visualize, explore, and analyze complex datasets. In particular, meteorologically interesting information in such data often appears as spatio-temporal patterns in physical fields like wind speed, temperature, and pressure. The ability to automatically identify and track such geometric patterns is therefore particularly useful for scientific analysis. At VGL, we have developed novel frameworks for exploratory analysis that enable scientists to conveniently extract and visualize features of interest from noisy spatio-temporal datasets. Our frameworks use geometry and topology to provide robust and efficient solutions for the visual exploration of meteorologically interesting information from complex data. We highlight a few results below.
An Exploratory Framework for Cyclone Identification and Tracking
Identification and tracking of extra tropical cyclones is a challenge for meteorologists because of their varied size, strengths, and lifecycle characteristics. To address this challenge, we proposed a novel pipeline for the exploration of cyclones and their temporal evolution. By combining the robustness of topological approaches with detailed tracking information from optical flow analysis, our framework facilitates the identification of cyclones and generates simplified smooth tracks. Packaged as a query driven visualization framework with a few easy to understand parameters, our method presented a novel flexible means of visualizing features of interest.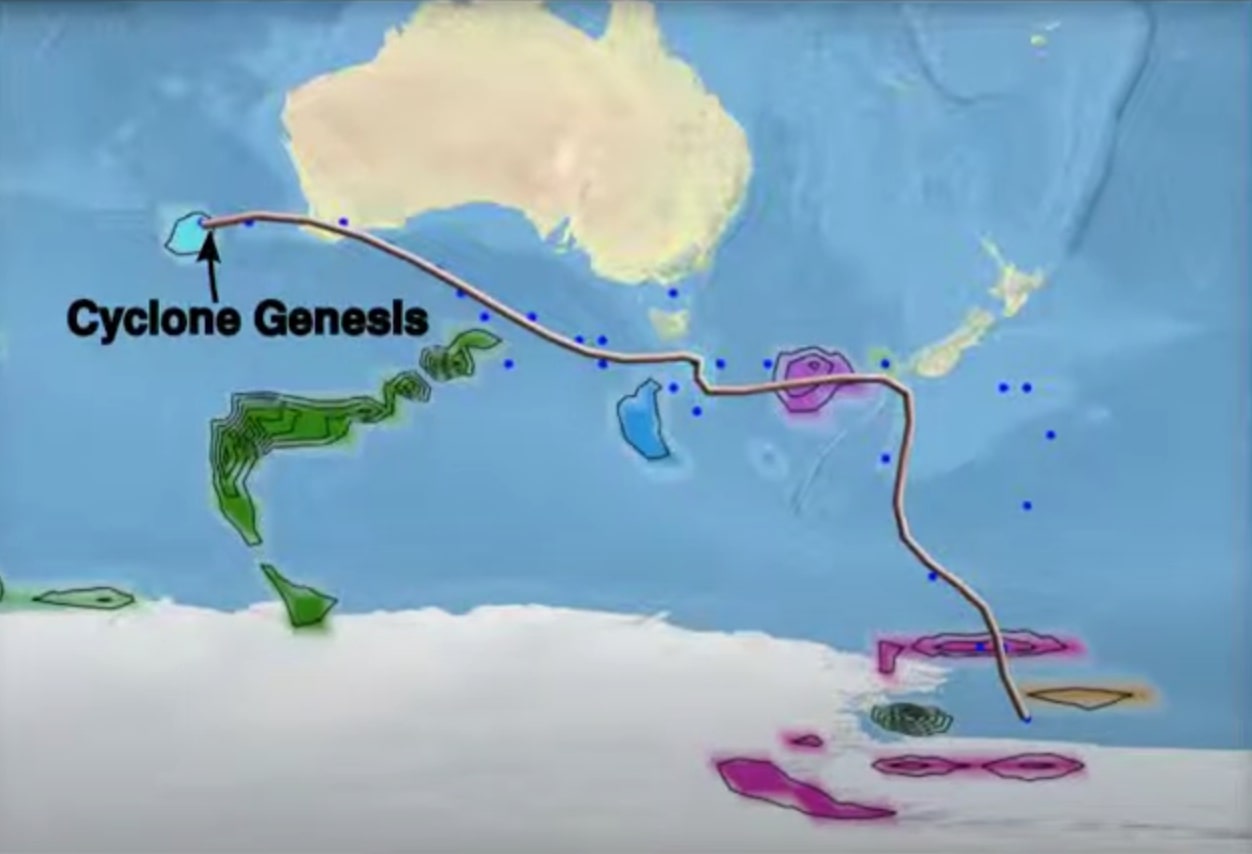
Tracking cyclones in the Australian Bight. The colored contours represent identified cyclone centres. The curve represents the cyclone track for the cyan cyclone centre.
Identification and Visual Analysis of Rossby Wave Packets
Rossby Wave Packets (RWPs) are giant meanders in the jet streams of high altitude winds that have been closely linked with extreme weather events. While meteorologists are interested in their automated identification and tracking, the RWP’s complicated wave structure and tendency to frequently change shape, size, and intensity make this a particularly challenging problem. Given these challenges, we proposed the use of topological methods as a novel alternative to existing approaches for RWP identification. In contrast to earlier work, our robust topology-based method and a novel graph-based representation allowed for a fine-grained extraction of wave components, helping climate scientists not only conveniently identify RWPs from complex arrangements but also perform novel statistical analysis on trends of RWP movements.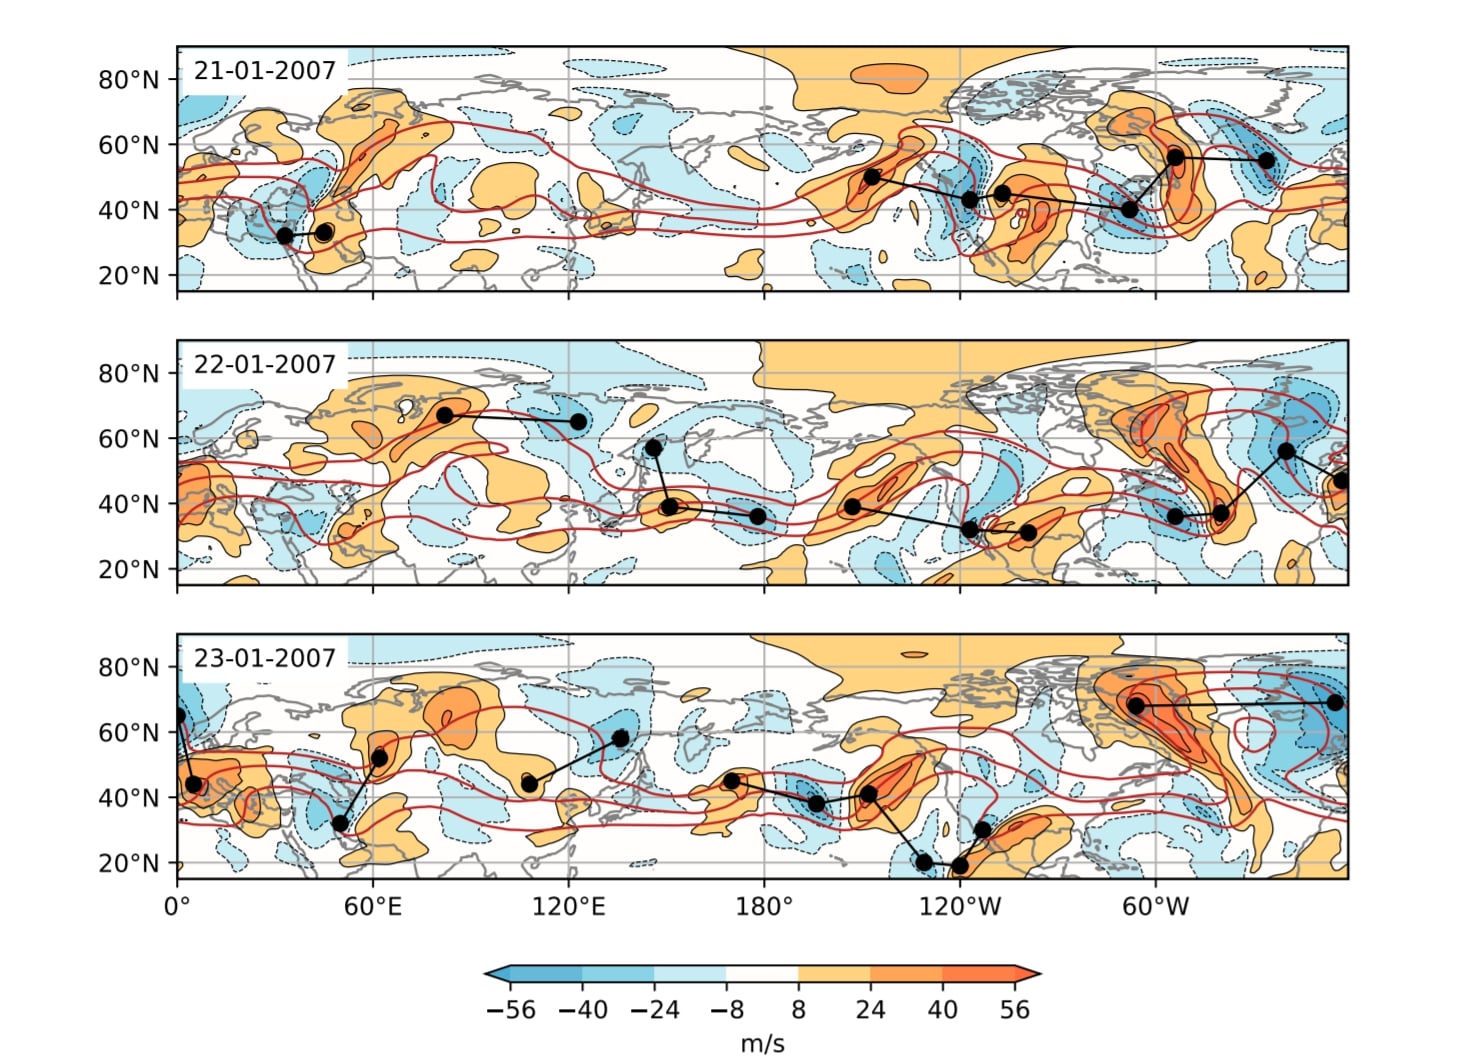
The identified development of an RWP. Filled contours represent the meridional wind speed field, with blue corresponding to negative, and red/orange corresponding to positive values. The graph representation of the RWP is shown using black nodes and edges.
Publications
- Akash Anil Valsangkar, Joy Merwin Monteiro, Vidya Narayanan, Ingrid Hotz and Vijay Natarajan.
An exploratory framework for cyclone identification and tracking. - Karran Pandey, Joy Merwin Monteiro and Vijay Natarajan.
An Integrated Geometric and Topological Approach for the Identification and Visual Analysis of Rossby Wave Packets