Reeb Graphs
People involved: Harish DoraiswamyVisual interpretation of scientific data enhances the comprehension of the data. Scientific data is typically obtained from scientific instruments such as sensors and imaging devices, and from simulations. The data is often represented as scalar functions that assign a real value to points in a geometric domain. For example, data obtained from a CT scan is in the form of points that occupy a 3-dimensional grid, the function value at each point being its radiodensity. Advances in computational resources has primarily resulted in increasing the size of data that is available for analysis. Constructing a meaningful abstraction of such data results in not just decreasing its size, but also helps ease the analysis. In this project, we study one such abstraction known as the Reeb graph, which abstracts the topology of the underlying data.
Level set topology and Reeb graphs
A level set consists of all points where the function attains a given value, called the iso-value. Level sets are used extensively to visualize three and higher dimensional scientific data. The Reeb graph tracks topology changes in level sets of a scalar function, and therefore provides a good abstraction for the given data. Reeb graphs and their loop-free version, called contour trees, have a variety of applications including topology-based shape matching, topological simplification and cleaning, surface segmentation and parametrization, and efficient computation of level sets. The Reeb graph serves as an effective user interface for selecting meaningful level sets, for designing transfer functions for volume rendering and for exploring high dimensional data.
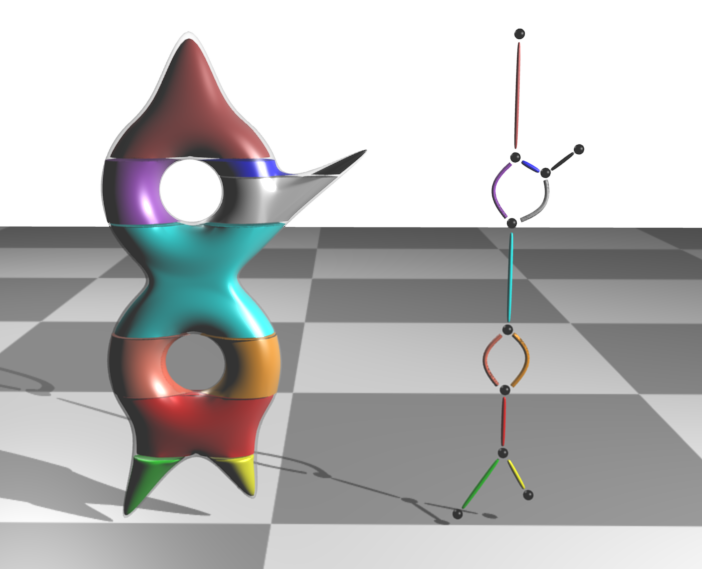
Reeb graph of the height function defined on a solid 2-torus. Reeb graph tracks the topology of level sets.
This work targets the following three aspects that are essential for the use of Reeb graphs for visualization of scientific data – (1) Efficient computation of Reeb graphs, (2) Effective visualization of Reeb graphs, and (3) Applications of Reeb graphs.
Reeb graph computation
Rapidly increasing data sizes and the interactivity requirement in the above-mentioned applications necessitate the development of algorithms for fast computation of Reeb graphs that are capable of handling relatively large input sizes. The primary focus of this research was to establish an efficient and fast algorithm to compute Reeb graphs. To that effect, we propose the following three algorithms that compute the Reeb graph of a scalar function in any dimension.
- The Sweep algorithm: This algorithm uses an efficient tree-cotree decomposition to maintain connected components of level sets of a 3-dimensional input and computes the Reeb graph in O(n log n + n log g (log log g)3) time, where n is the number of triangles and g is the maximum genus over all level sets of the scalar function. We extend this approach to use the dynamic connectivity algorithm to maintain connected components of level sets in higher dimension. This resulted in an O(n log n(log log n)3) algorithm that computes the Reeb graph of scalar functions in any dimension. This was the first sub-quadratic time algorithm and is a significant improvement over the previously known O(n2) algorithms.
- The Cylinder Map algorithm: The use of complex data structures to maintain level sets in the sweep algorithm does not result in an efficient implementation. The cylinder map algorithm avoids explicitly maintaining level sets by using an alternate definition of the Reeb graph that considers equivalence classes of level sets instead of individual level sets. This approach resulted in an algorithm that is simple to implement and has a running time of O(n + l + t log t), where t is the number of critical points of the input, and l is the size of all critical level sets. We also show that this algorithm performs upto an order of magnitude faster than the previously known generic algorithms.
- The Recon algorithm: This algorithm builds upon the cylinder map algorithm by aggressively employing the efficient algorithm by Carr et al. that computes loop-free Reeb graphs. It splits the input into a set of loop-free subvolumes, and constructs the Reeb graph of the input by merging the Reeb graphs of all the subvolumes. The algorithm has a running time of O(v log v + sn), which is close to the lower bound Ω(v log v + n). Here v is the number of vertices, and s is the number of saddles in the input. This approach outperforms current generic algorithms by a factor of up to two orders of magnitude, and has a performance on par with algorithms that are catered to restricted classes of input. The algorithm is also amenable to handle large data that do not fit in memory.
Visualization of Reeb graphs
Effective visualization of Reeb graphs is crucial for its application to noisy or feature-rich data. We accomplish this by addressing the following two important issues.
- Simplification: We develop a method to simplify the Reeb graph based on the notion of extended persistence that removes short leaves and cycles in the graph. The advantage of this approach is that, it easily extends to handle other notions of importance such as hyper volume.
- Layout: We propose a feature-directed layout of the Reeb graph that serves as a useful interface for exploring and understanding three-dimensional scalar fields. We also developed a method to generate an embedded layout of the Reeb graph such that the embedding lies in the interior of the volume.
We also developed a software which allows users to interactively explore 2D and 3D scalar fields using the Reeb graph.
Demonstration of Reeb graph assisted interactive exploration and visualization of Visible human dataset.
Application of Reeb graphs
We used Reeb graphs in four applications – segmentation of a surface mesh into meaningful parts, visualization of interval volumes, spatially-aware flexible transfer function design, and interactive exploration of time-varying data.
Additionally, we introduce topological saliency, a notion of importance that captures the relative importance of a topological feature with respect to other features in its local neighborhood. We demonstrated the advantage of using topological saliency along with the Reeb graph in several applications, including key feature identification, scalar field simplification, and feature clustering.
Publications
- Harish Doraiswamy, Nithin Shivashankar, Vijay Natarajan and Yusu Wang.
Topological saliency. - Harish Doraiswamy and Vijay Natarajan.
Computing Reeb graphs as a union of contour trees. - Senthilnathan Maadasamy, Harish Doraiswamy and Vijay Natarajan.
A hybrid parallel algorithm for computing and tracking level set topology. - Harish Doraiswamy and Vijay Natarajan.
Output-sensitive construction of Reeb graphs. - Harish Doraiswamy and Vijay Natarajan.
Computing Reeb graphs as a union of contour trees. - Harish Doraiswamy, Aneesh Sood, and Vijay Natarajan.
Constructing Reeb graphs using cylinder maps. - Harish Doraiswamy and Vijay Natarajan.
Efficient algorithms for computing Reeb graphs. - Harish Doraiswamy and Vijay Natarajan.
Reeb graphs. - Harish Doraiswamy and Vijay Natarajan.
Efficient output-sensitive construction of Reeb graphs.
Software
-
libRG
A library to compute Reeb graph of a scalar function defined on a simplicial mesh.
-
ReCon
A fast algorithm to compute Reeb graph of a scalar function defined on a simplicial mesh.